
*AI Translated
An online survey on “Movies You Want to See This Winter” was conducted by Cinebridge and Testee, targeting 1,200 males and females aged 12 to 22 (teens and early twenties). (Survey period: September 1–24, 2026)
In recent years, the trends and enthusiasm of younger audiences have had a major impact on both opening weekend and long-running box office hits. This survey ranked the most anticipated winter releases based on viewing intentions, and also analyzed the latest motivations and consumption trends among young people when it comes to going to the movies. This article introduces the findings in detail.

Viewing Trends Among Young Audiences Revealed by the Survey
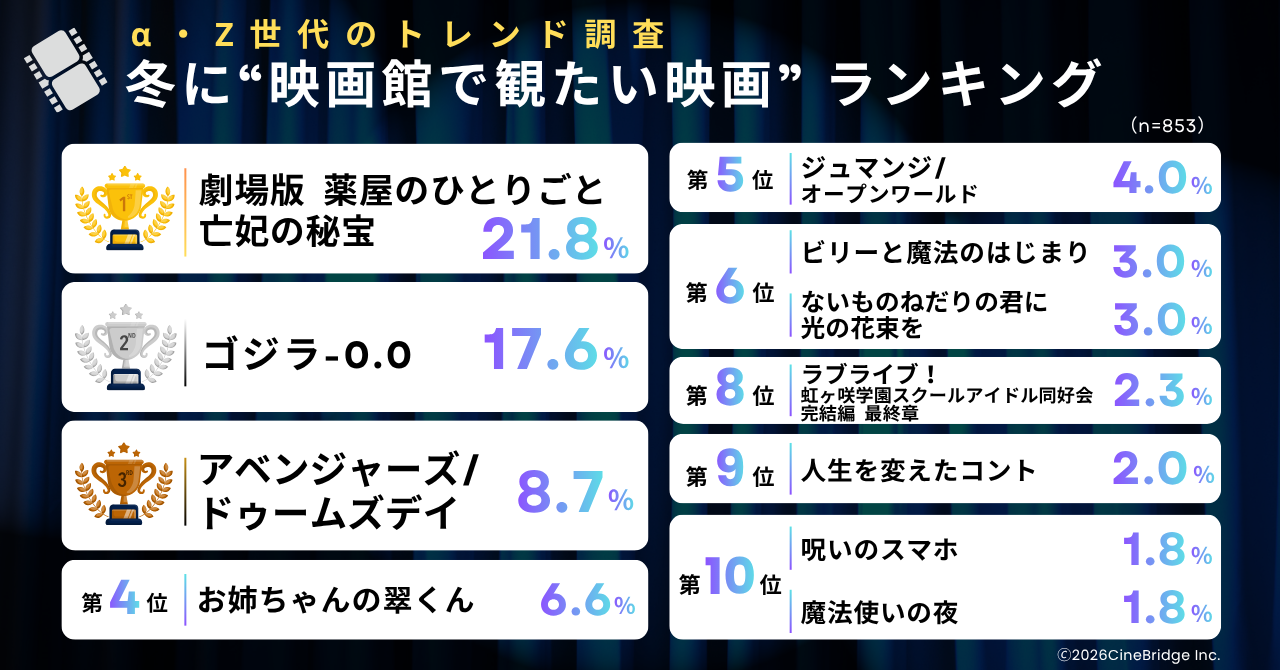
“The Apothecary Diaries: The Movie” Tops the List with 21.8%
“The Apothecary Diaries: The Movie” took first place. The most common reason for wanting to see it was “Because I like the original story (75.8%),” indicating a strong and passionate fan base that is expected to drive steady attendance.
Blockbuster Appeal: Seeking the Ultimate Immersive Experience Only Theaters Can Offer
Second place went to “Godzilla -0.0,” and third to “Avengers: Doomsday,” both large-scale spectacle films that truly shine on the big screen with powerful sound—demonstrating strong support for movies best experienced in theaters.
“Empathy and Emotional Consumption” Brighten Up Winter Break
Romance and coming-of-age films like “My Sister’s Midori-kun” (4th place) and “A Bouquet of Light for You Who Always Want More” (6th place) also performed well. There is solid demand for moviegoing as a leisure activity to “share emotions with friends or a partner,” which remains consistently popular.
Trend Analysis Among Young Audiences
1. Actual Movie Theater Usage Among Young People (By Generation)
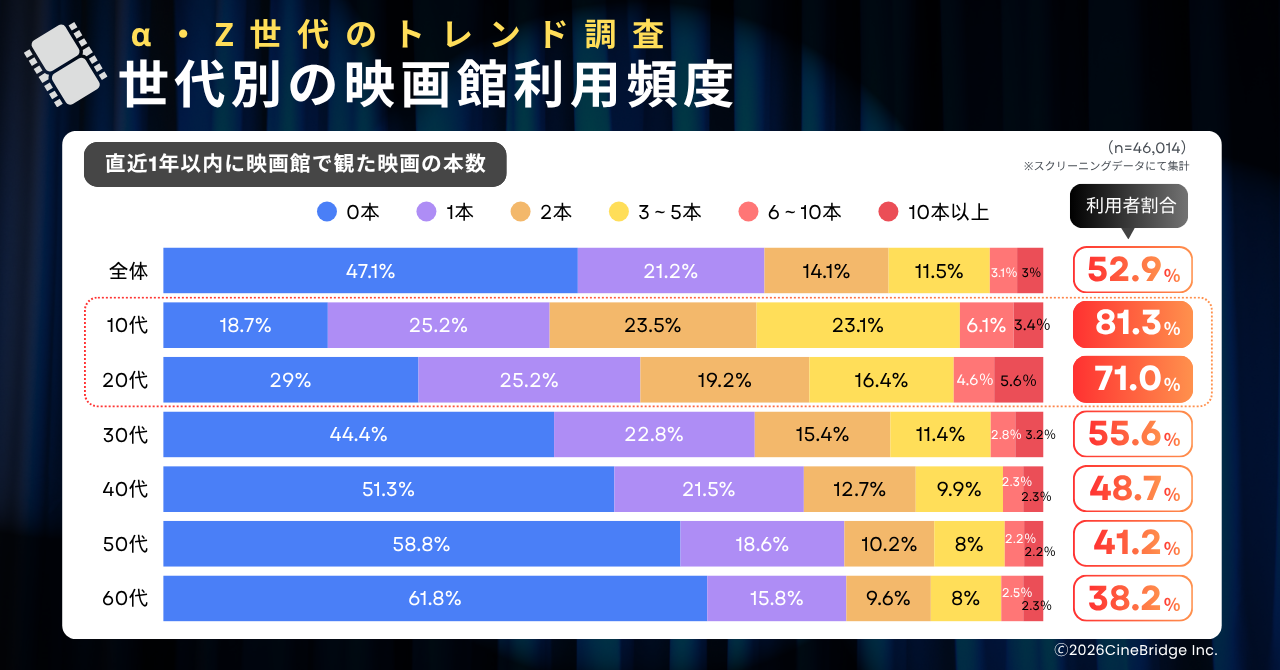
The percentage of people who saw at least one movie in theaters in the past year was 81.3% among teens and 71.0% among those in their twenties, far surpassing those in their thirties and older (55.6% or less), and ranking highest among all age groups.
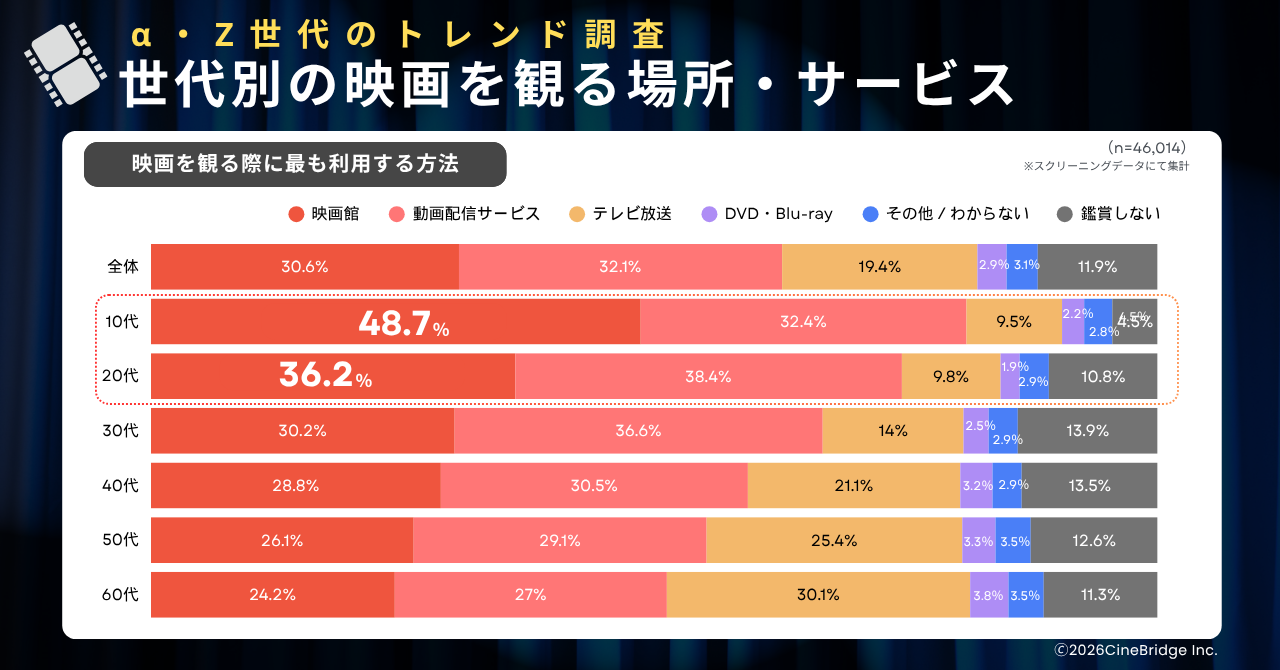
Furthermore, teens were most likely to choose “movie theater” as their primary channel for watching movies, at 48.7%—the highest among all age groups—highlighting how much the theater market is supported by young people.
2. “Real Shared Experiences” Sought by the Streaming Generation
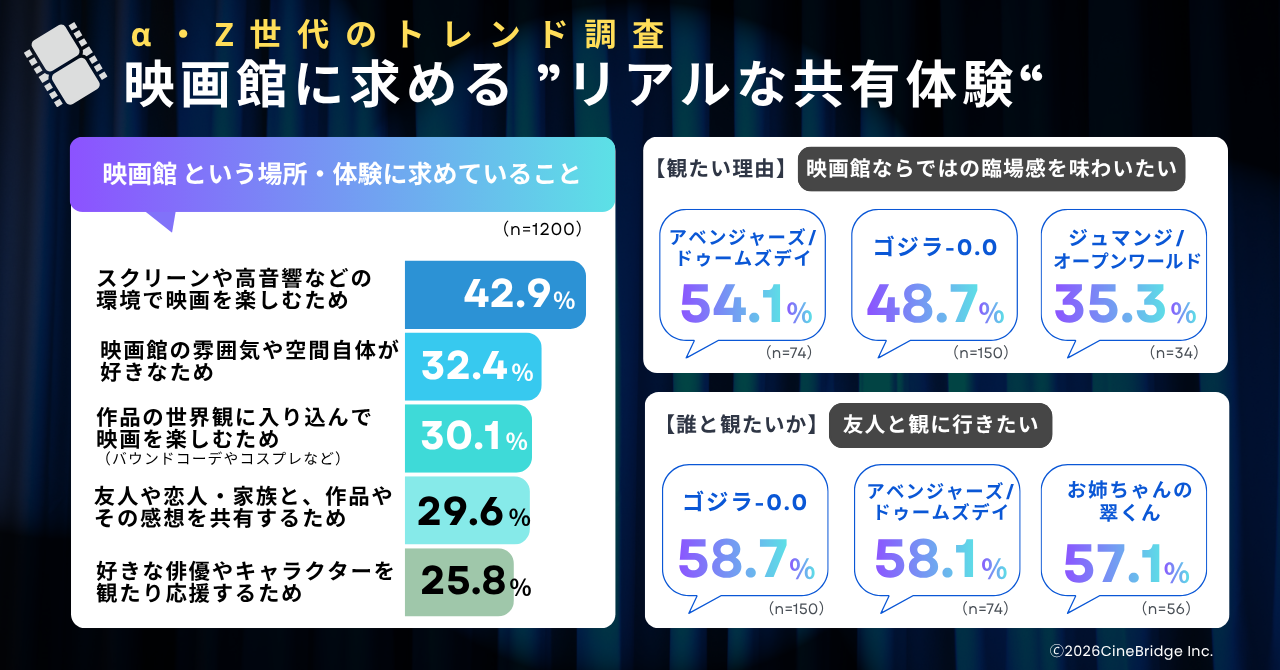
Even though this generation is accustomed to watching via streaming (VOD), what they seek in theaters is the opposite of “time efficiency”—they want the “big screen and powerful sound (42.9%)” and “to share emotions with friends or a partner (29.6%),” showing a desire for authentic theater experiences.
What People Want from the Movie Theater Experience (n=1200)
To enjoy movies with features unique to theaters, such as large screens and high-quality sound: 42.9%
Because I like the atmosphere and space of the movie theater itself: 32.4%
To immerse myself in the world of the film (such as through bound coordination or cosplay): 30.1%
To share the experience and impressions of the film with friends, partners, or family: 29.6%
To watch or support my favorite actors or characters: 25.8%
Reasons for Wanting to Watch: "To Experience the Unique Immersion Only Movies Can Offer"
Avengers / Doomsday: 54.1% (n=74)
Godzilla Minus One: 48.7% (n=150)
Jumanji / Open World: 35.3% (n=34)
Who Do You Want to Watch With? "I Want to Go with Friends"
Godzilla Minus One: 58.7% (n=150)
Avengers / Doomsday: 58.1% (n=74)
My Sister's Midori-kun: 57.1% (n=56)
3. The Movie Experience of "Chiikawa" Expands IP Popularity
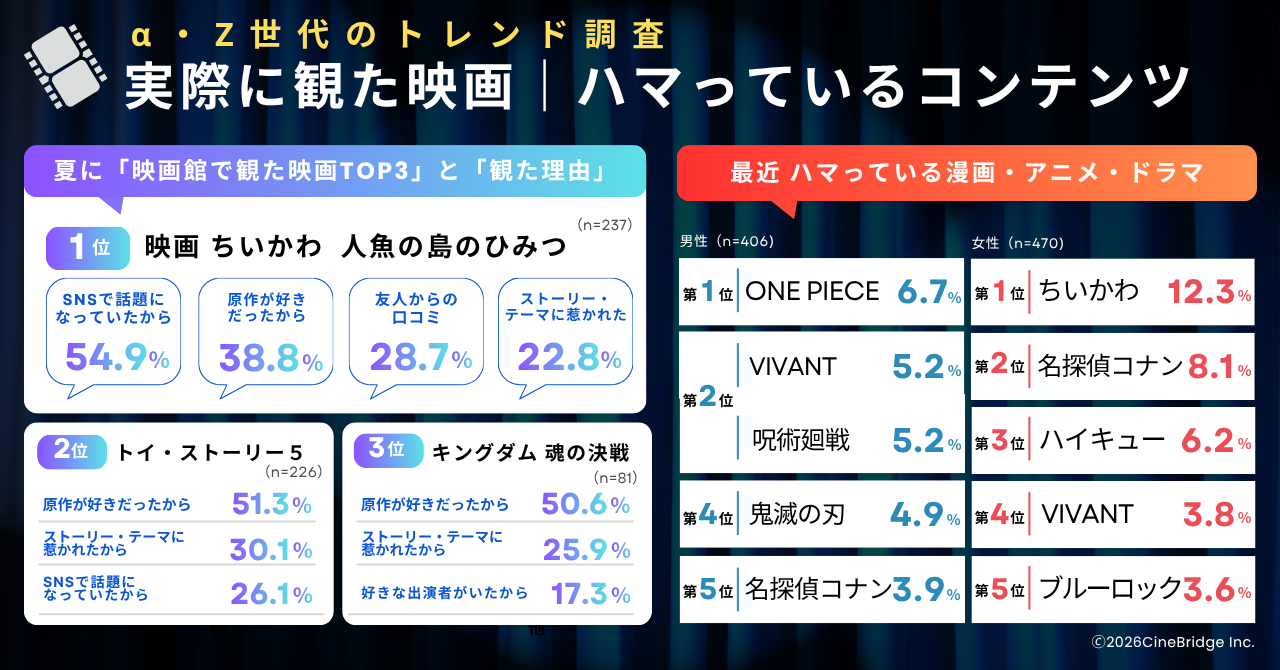
"Chiikawa the Movie" made a rapid leap from 8th place in pre-release viewing interest to 1st place in actual viewership. Its popularity also spread to the top ranks of "anime people are into," and as it went viral on social media, the number of viewers surged. This demonstrates the real synergistic effect of movie adaptations in expanding IP popularity and the fan base through the theater experience.
A consumption cycle has been established, starting with the movie experience: "Anticipation of a Hit" ⇒ "Buzz on Social Media" ⇒ "Experience and Empathy at the Theater" ⇒ "Becoming a Fan."
Top 3 Movies Watched in Theaters This Summer and Reasons for Watching
1st: Chiikawa the Movie: The Secret of Mermaid Island (n=237)
"Because it was trending on social media": 54.9%
"Because I liked the original work": 38.8%
"Word of mouth from friends": 28.7%
"I was attracted by the story or theme": 22.8%
2nd: Toy Story 5 (n=226)
Because I liked the original work: 51.3%
Because I was attracted by the story or theme: 30.1%
Because it was trending on social media: 26.1%
3rd: Kingdom: Soul Showdown (n=81)
Because I liked the original work: 50.6%
Because I was attracted by the story or theme: 25.9%
Because my favorite actor was in it: 17.3%
Recently Popular Manga, Anime, and Dramas
Men (n=406)
1st: ONE PIECE 6.7%
2nd: VIVANT 5.2%
2nd: Jujutsu Kaisen 5.2%
4th: Demon Slayer: Kimetsu no Yaiba 4.9%
5th: Detective Conan 3.9%
Women (n=470)
1st: Chiikawa 12.3%
2nd: Detective Conan 8.1%
3rd: Haikyu!! 6.2%
4th: VIVANT 3.8%
5th: Blue Lock 3.6%
4. Comparison of Consumption Behavior Between Moviegoers and Non-Moviegoers
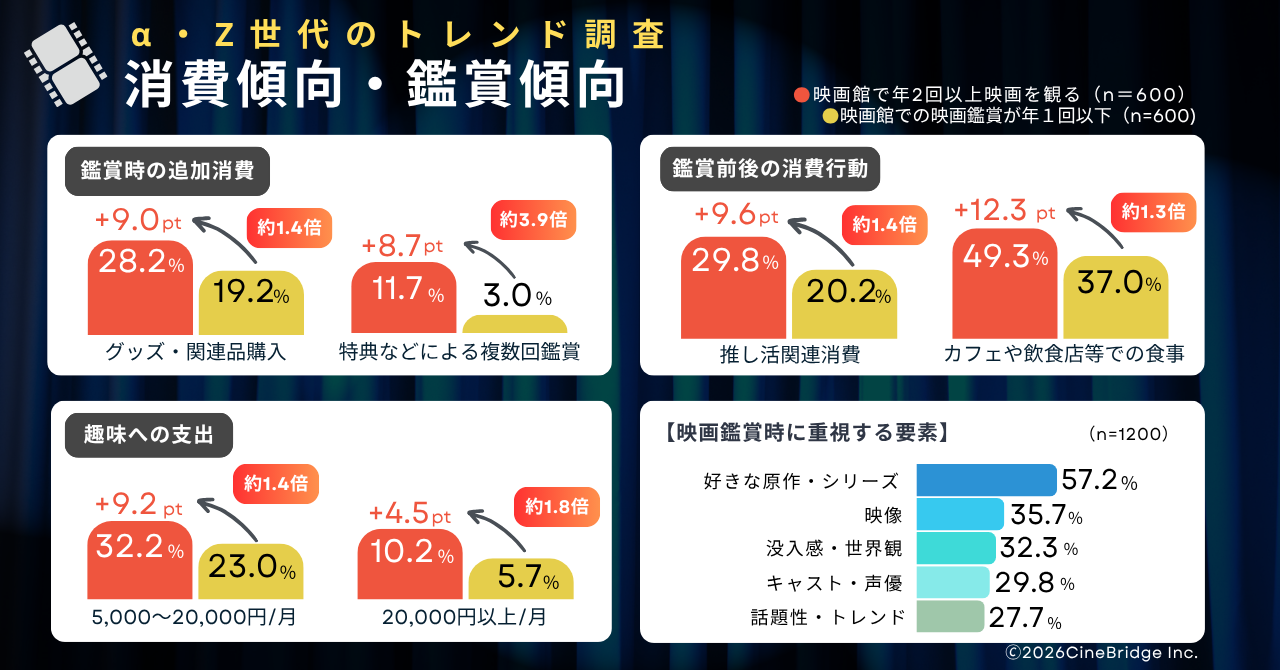
People who regularly go to the movies ("moviegoers") are much more willing to invest in their hobbies and are extremely active in related purchases and supporting their favorites, compared to non-moviegoers.
Red = Watch movies at the theater two or more times a year (n=600) Yellow =Watch movies at the theater once a year or less (n=600)
Additional Spending When Watching Movies
Purchase of merchandise and related products 28.2%←19.2%
Multiple viewings for special bonuses, etc. 11.7%←3.0%
Consumption Behavior Before and After Viewing
Spending related to Oshi activities 29.8%←20.2%
Meals at cafes or restaurants, etc. 49.3%←37.0%
Spending on Hobbies
5,000–20,000 yen/month 32.2%←23.0%
20,000 yen or more/month 10.2%←5.7%
Key Factors When Watching Movies (n=1200)
Favorite original work or series 57.2%
Visuals 35.7%
Immersion and world-building 32.3%
Cast and voice actors 29.8%
Buzz and trends 27.7%
Fan Consumption Driven by Love for the Work (Additional Purchases & Repeat Viewings)
The percentage of moviegoers who "purchase merchandise and related products (28.2%)" is about 1.4 times higher, and those who "watch the movie multiple times for admission bonuses, etc. (11.7%)" is about 3.9 times higher, showing a significant difference. This demonstrates that strong attachment to a work directly leads to higher spending and repeat viewings.
Linked Consumption Around Cinemas (Oshi Activities & Dining)
Among moviegoers, "spending related to Oshi activities" is 29.8% (about 1.4 times higher). In addition, "meals at cafes or restaurants before or after viewing" reaches 49.3% (about 1.3 times higher), indicating that the cinema experience serves as a powerful catalyst for surrounding consumption.
High Willingness to Spend on Entertainment and Hobbies
Among moviegoers, 32.2% have a monthly budget of "5,000–20,000 yen" (compared to 23.0% for non-moviegoers), and 10.2% spend "20,000 yen or more" (compared to 5.7% for non-moviegoers), suggesting a tendency to actively invest in entertainment on a regular basis.
[Reference] Key Factors When Watching Movies
The most important factor in choosing a movie is "favorite original work or series (57.2%)". This is followed by "visuals (35.7%)" and "immersion and world-building (32.3%)", showing that attachment to IP and the unique experience of theaters are major motivations for visiting cinemas.
Summary: The Value of Cinemas in Youth Marketing
This survey reconfirms that, for Generation Alpha and Generation Z, cinemas are special places that provide "overwhelming immersive experiences" and "empathetic consumption".
With the synergistic effect of cinema experiences boosting fan enthusiasm and IP popularity, as well as the strong purchasing power unique to cinemas, CineBridge Inc. will continue to strengthen its proposals for effective in-theater solutions that resonate with young audiences.
[Survey Overview]
- Survey target: Male and female junior high, high school, and university students aged 12–22
- Survey period: September 1–24, 2026
- Valid responses: Total 1,200 samples (400 junior high, 400 high school, 400 university students)
- Survey method: Internet survey (using "Powl")
- Joint survey: CineBridge Inc. / TesTee Inc.
*When quoting or reproducing this published data, please be sure to credit "Survey by CineBridge Inc. and TesTee Inc."
About CineBridge Inc.

A leading company maximizing the potential of in-theater solutions with a focus on cinema advertising. With the mission of "creating new emotional experiences and transforming them into the power to live for everyone," CineBridge aims for a future where even advertising time in evolving cinemas—now hubs of moving experiences—becomes a prologue to emotional immersion for audiences.
About TesTee Inc.

Testee Inc. operates advertising and online research businesses utilizing chatbots.
The company conducts research leveraging the opinions of 6 million users (as of the end of October 2024) registered with the rewards app “Powl,” with the strength of being able to visualize the realities of the hard-to-reach younger demographic.
URL: www.testee.co
🚅Book your Shinkansen ticket with NAVITIME Travel! 👉 Click here
🛫Book your flight ticket with NAVITIME Travel! 👉 Click here
😄Enjoy a more convenient trip to Japan with NAVITIME eSIM!👉Click here
👉Book Hotels & Ryokan on JAPANiCAN🏨


Comments